On "Showing Your Work"
How can you showcase the sheer brilliance of your statistical approach in a way that's both informative and easy to follow?

Table of Contents
First penned for Silicon Mountain's official blog. I'm sharing the content here as well for broader visibility.
Introduction
It’s been almost two years now since my data science journey began, and over the past couple of years, I’ve completed my MS in Business Analytics and worked on a few machine learning projects for various organizations, both in school and during my ongoing career. I’ve come to realize that proficiency in analytical techniques is only one part of the equation to satisfy project stakeholders. What’s more, is effectively communicating your data insights in a manner that resonates with stakeholders to drive meaningful change. What’s the point of analyzing anything if your audience can’t easily comprehend your work and take action on the insights? This is exactly why “showing your work” in analytics is such a critical concept.
Alright, let's tackle the question: “how can you showcase the sheer brilliance of your statistical approach in a way that's both informative and easy to follow?” Well, a good place to start is with the precise documentation of your code and the step-by-step logic of your solution. Doing so will not only add credibility to your work but also promote its reproducibility and transparency, which builds trust.
Why do reproducibility and transparency matter? You may ask.
If you want to join me as I delve deeper into the significance of "showing your work" and cover the essential elements and benefits of reproducible, transparent analytical research, I invite you to keep reading.
Importance of Reproducibility and Explainable Machine Learning
Reproducibility is a fundamental principle of scientific research that holds tremendous significance in data science, given the complex methods often used. It refers to the ability to recreate an analysis and its outcomes independently using the same data and code initially employed. Without obtaining consistent computational results using the same input data, logical steps, procedures, code, and analysis conditions, we disable ourselves as a community from verifying the accuracy and reliability of scientific findings, thus obstructing transparency and accountability in our shared collective knowledge.
To ensure the integrity of scientific research, it is crucial to consider not only reproducibility but also replicability. Replicability refers to the ability of an independent experiment targeting the same scientific question to produce consistent results using newly collected data. These two concepts, while related, serve distinct purposes. Reproducibility helps us ensure findings are not due to random errors or biases while replicability ensures that the findings are generalizable and not specific data collection.
While both reproducibility and replicability are essential, replicability can be expensive, especially for large-scale projects. For instance, obtaining comparable data or samples, funding a research team, and avoiding copyright or ethical issues can be challenging when replicating an experiment.
Given these challenges, the ability to compute the same analysis results from the same observed dataset with knowledge of the analysis pipeline is increasingly crucial. In particular, here are some ways to affirm reproducibility:
- sharing analytical data and code,
- documentation of data, processing, and statistical methods,
- attention to code style, file formats, packaging,
- ability to verify methods.

In the realm of decision-making, the successful implementation of responsible algorithmic decisions relies on the harmonious combination of reproducibility and explainability. These two concepts are intrinsically linked, as understanding a machine-learning model's functionality and decision-making process is essential for reproducing its results. To foster trust in the model, the underlying mechanisms and choices made by the model must be transparent, readily comprehensible, and easily interpreted by human users. By achieving this balance, stakeholders can confidently embrace algorithmic decision-making as a valuable tool for making well-informed choices.
Reproducibility and Data Science
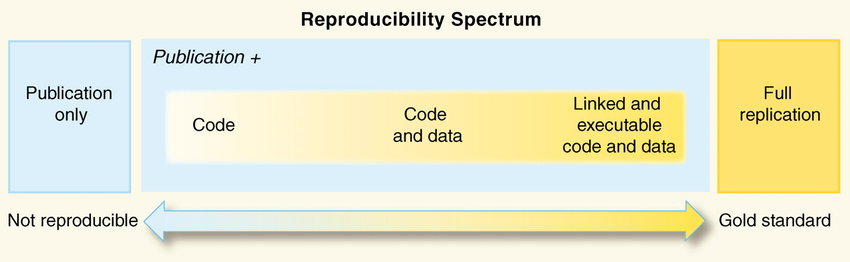
Again, reproducibility refers to the capability of generating identical data analytics results when using the same observed dataset with knowledge of the data analysis process. This concept lives on a "Reproducibility Spectrum" between "Publication Only" and the "Gold Standard." The three stages between these ends are as follows:
- code (Publication Only - not reproducible)
- code and data
- linked and executable code and data (Gold Standard - Full replication).
Meeting the “Gold Standard” is not always easy. Challenges facing reproducibility in data science stem from several factors that can complicate obtaining consistent results across different instances of an analysis. Some of these challenges include:
- Varying methodologies: Different analysts might apply various techniques or models to address the same problem, leading to inconsistencies in results. Determining the most appropriate or accurate approach can be difficult, and this lack of standardization can hinder reproducibility.
- Data storage and accessibility: Data storage formats and locations can vary across organizations or even within the same team, making it difficult to access and use data consistently. Additionally, issues related to data privacy and sharing restrictions can also hinder reproducibililty sometimes.
- Software versions and dependencies: Discrepancies in software versions, libraries, or packages used in the analysis can lead to different results and compatibility issues. Ensuring all analysts work with the same software configurations is needed to achieve reproducible results.
- Lack of documentation: Poorly documented code, methodologies, or data sources can make it difficult for others to understand and replicate an analysis. Proper documentation is essential for promoting transparency and enabling reproducibility.
- Randomness and seed values: Some analytical methods involve random processes or sampling, which can lead to varying results. Setting and documenting seed values that control the randomization process is also essential.
Addressing these challenges are basic steps to promote reproducibility within and between organizations. By doing so, organizations and teams can enjoy several benefits, such as improved collaboration, error detection, and validation of results.
Best Practices for Ensuring Reproducibility
I like to ensure reproducibility and facilitate understanding in my data analysis through Jupyter Notebooks in conjunction with version control systems like Git. The two provide a seamless environment for me to experiment with code, visualize results, and document my work. What I like most is the step-by-step execution, as working inside a notebook allows you to break your code into smaller, more manageable chunks (called "cells"). Cells make it easier for others to follow my logic linearly and clearly. For example, it's wise to include a cell at the beginning of your notebook that manages versions of packages used in the analysis with tools such as Conda or Pip.

On top of that, Jupyter supports Markdown. So you can write detailed descriptions and explanations and even include mathematical equations alongside your code. This rich support is excellent because it shows the reasoning behind your code, making it easier for others to read instead of just speculating from comments. Moreover, Jupyter supports visualizations, which is crucial for understanding and interpreting data. Showing plots, charts, and tables between cells makes it easier to convey complex information more effectively and more engaging for non-technical users to view. The cherry on top is that you can then take your code, plots, and inline Markdown and share them as a static HTML file or interactive notebooks hosted on GitHub or Colab, for instance.
The benefit of sharing via GitHub (or similar hosts for software development) is the ability to track your commits by keeping a log of the version history, so you may collaborate with others with a well-organized record of your work, allowing them to identify and fix changes in your code or documentation.
Having established the importance of reproducibility in analytics, it's crucial to consider how these principles mesh with achieving transparency through explainability. We will look towards the rapidly evolving field of machine learning as an example.
Explainable Machine Learning: Making Sense of Complex Models
Machine learning has experienced a surge in adoption across diverse industries driven by the ongoing digital transformation of our modern economy. As a result, there is a growing demand for responsible machine learning practices that promote transparency and risk management in algorithmic decision-making. Responding to this need, governing bodies and those affected by the decisions of models call for the developing and using more interpretable and explainable models, paving the way for the rise of Explainable Machine Learning (XML) and Explainable Artificial Intelligence (XAI) techniques.

In high-stakes applications, such as healthcare, finance, or criminal justice, black-box models do not cut it anymore, as people groups have and could continue to be adversely affected by systemic and human biases ingrained in models' training data, often unknowingly. Techniques such as LIME (Local Interpretable Model-agnostic Explanations), SHAP (SHapley Additive exPlanations), and ICE (Individual Conditional Expectations) and others have been developed to convert black-box models into glass-box ones and achieve explainability.
To better understand how trained models work and make predictions, there are various post-hoc approaches available. I will overview these methods and give examples using a hypothetical credit card default model, which predicts the probability of a credit card customer failing to pay their debts. These examples will demonstrate these approaches’ effectiveness:
- Direct measures of global and local feature importance. These techniques help us quantify the contribution of each feature to a model’s predictions, globally (overall) and locally (for specific observations). Looking at feature importance can determine which variables impact a model’s decisions most and potentially uncover any unexpected biases. In the image below, see how the H2O GBM model calculates variable importance rankings for credit lending practices, where a customer's most recent payment behavior is the most important variable in predicting default. PAY_0, PAY_2, and PAY_3 are the top three variables in order of importance in this example.

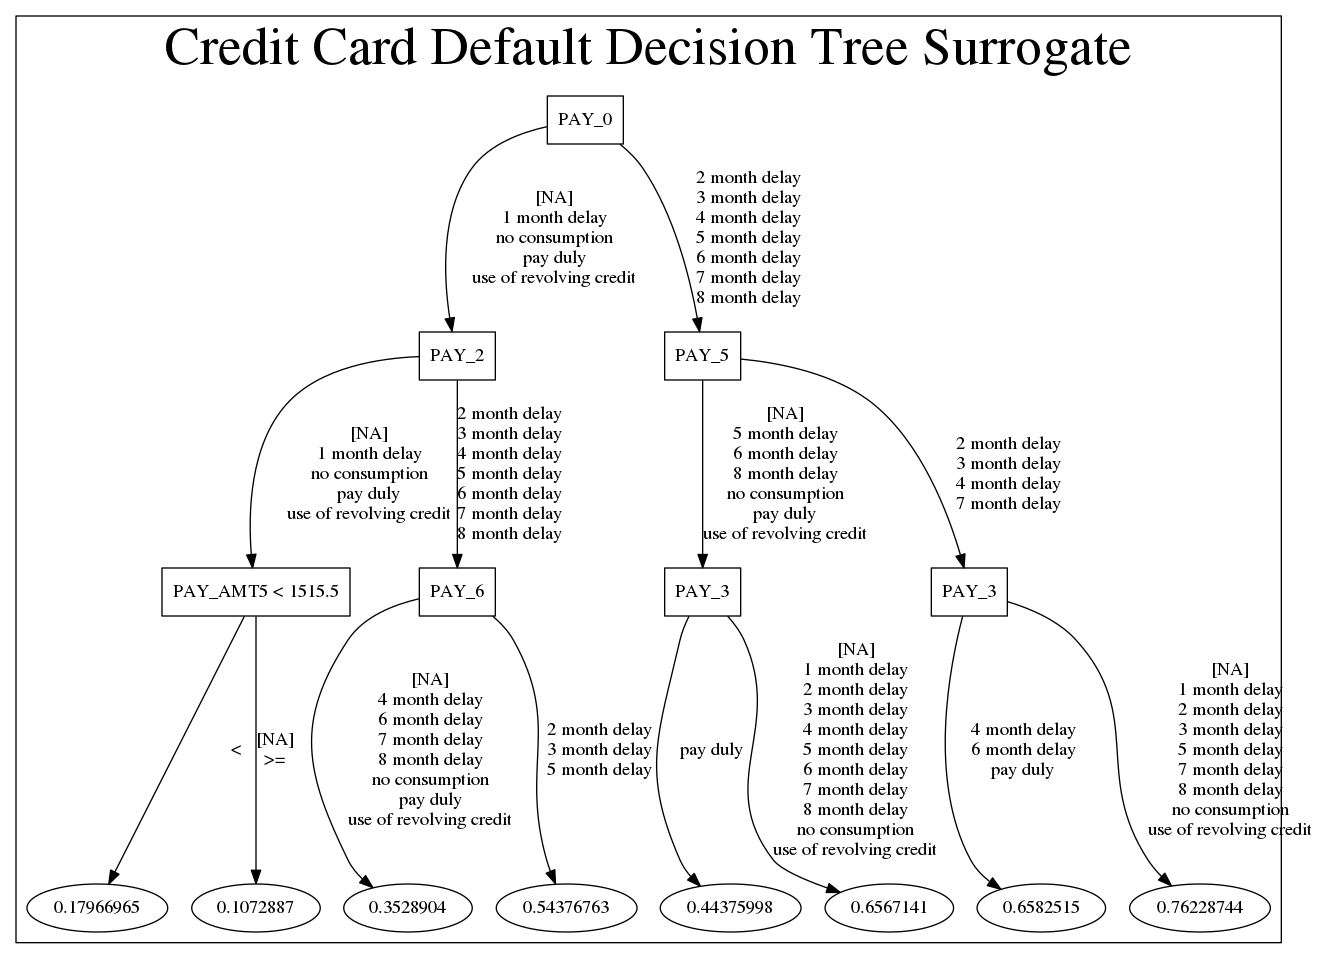
- Global and local surrogate models. Surrogate models approximate the behavior of more complex, black-box models, such as neural networks or support vector machines. Using a surrogate model provides insight into a complex model’s decision-making while maintaining a reasonably accurate representation of its predictions by mimicking its input-output relationships. In the example image below, witness how the decision tree surrogate model describes the before-mentioned model by recursively splitting the input space into nodes and sub-nodes using simple, human-readable decision rules based on the input features. Although it does not capture every detail of the original model, it can be used as an approximation for gaining insights into the model’s behavior.
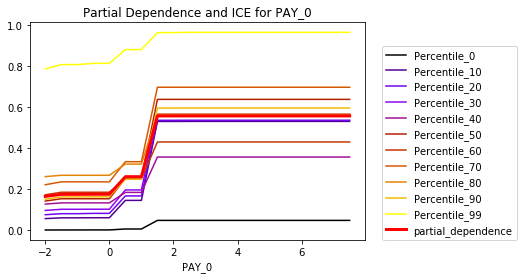
- Global and local visualizations of trained model predictions. Making visuals that help decision-makers explore the input-output relationships between features and predictions. These charts can identify potential patterns, trends, or anomalies in predictions. As you can see in the example plot, the likelihood of a customer defaulting on their loan increases, especially after becoming two months late on their most recent payment.
As you can see from the examples, “showing your work” in analytics goes beyond merely presenting model accuracy scores. It encompasses ensuring transparency and explainability in your models, so stakeholders can have a deeper understanding of the mechanisms behind-the-scenes, which builds trust and credibility, and helps decision-makers embrace your work in real-life applications.
Conclusion
Revisiting the question, “how can you showcase the sheer brilliance of your statistical approach in a way that's both informative and easy to follow?” By employing best practices, including comprehensive documentation, version control, and using tools like Jupyter Notebooks, we can establish a more collaborative, accountable, and dependable environment for sharing our work transparently, with a focus on reproducibility and explainability. By prioritizing transparency, reproducibility, and explainability, we can enable more informed and responsible decision-making in a world increasingly dependent on data and algorithms for making ethical, real-world choices.

Kyle's Blog
Join my blog to receive the latest updates in your inbox.


